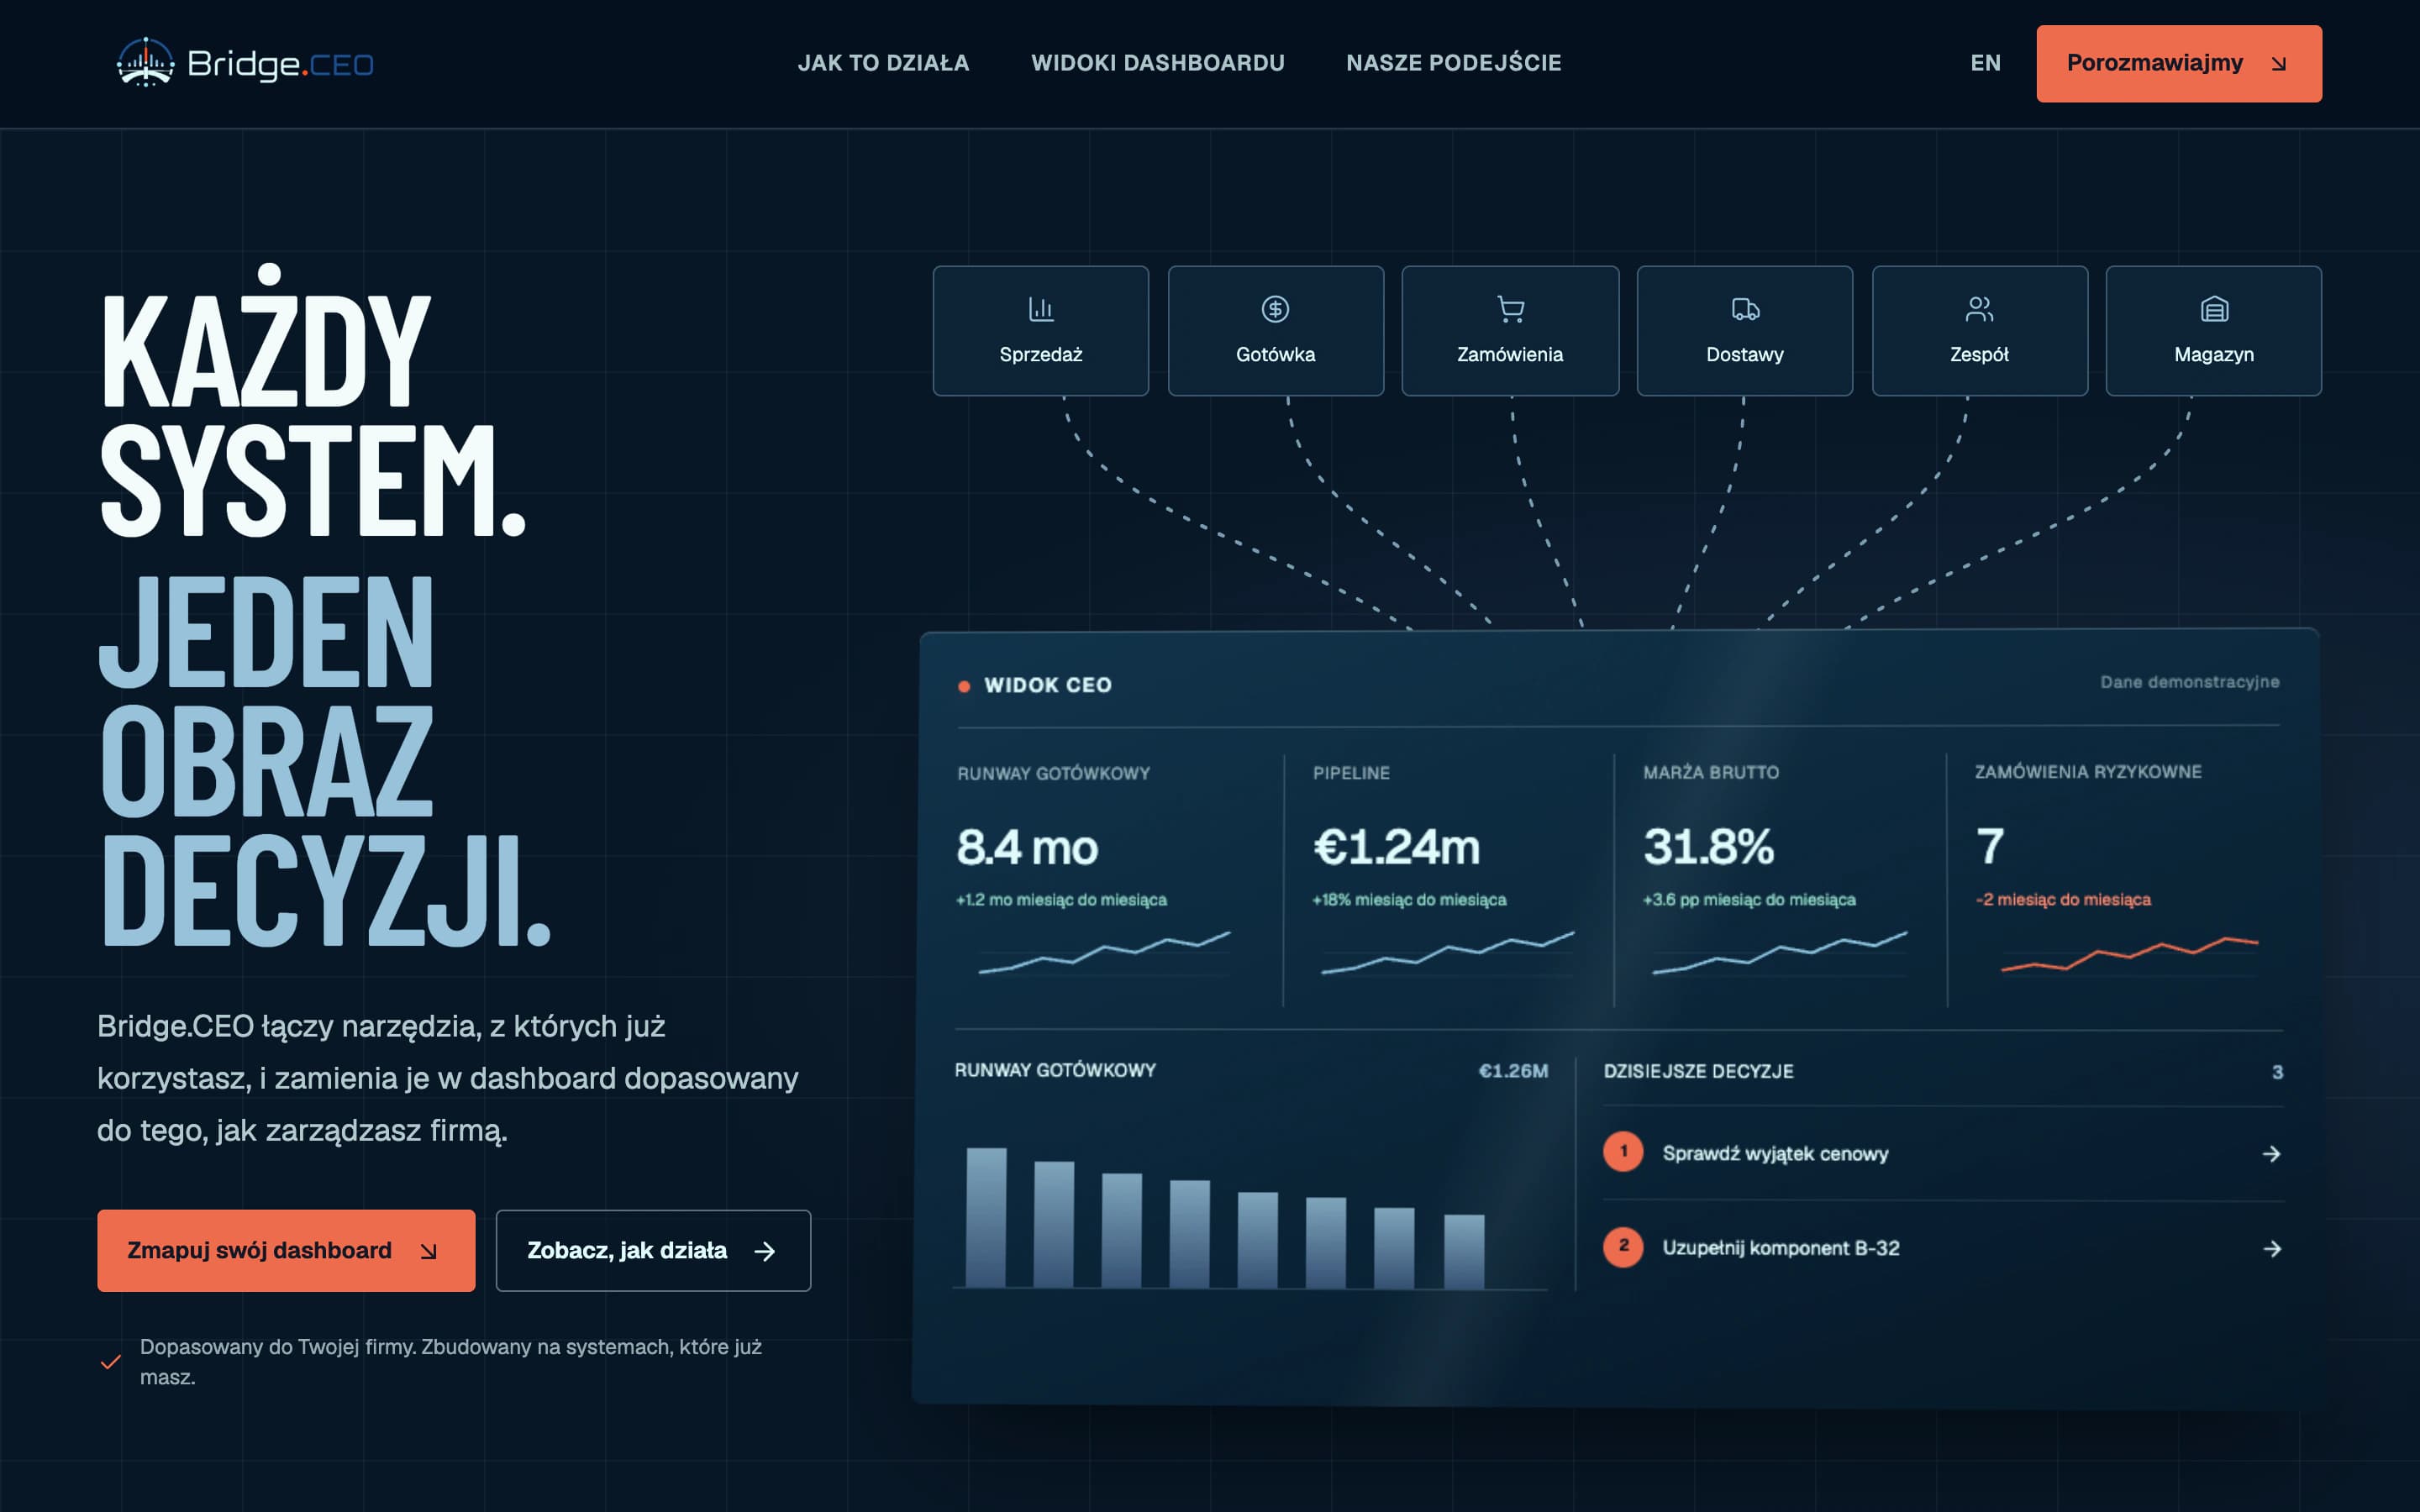
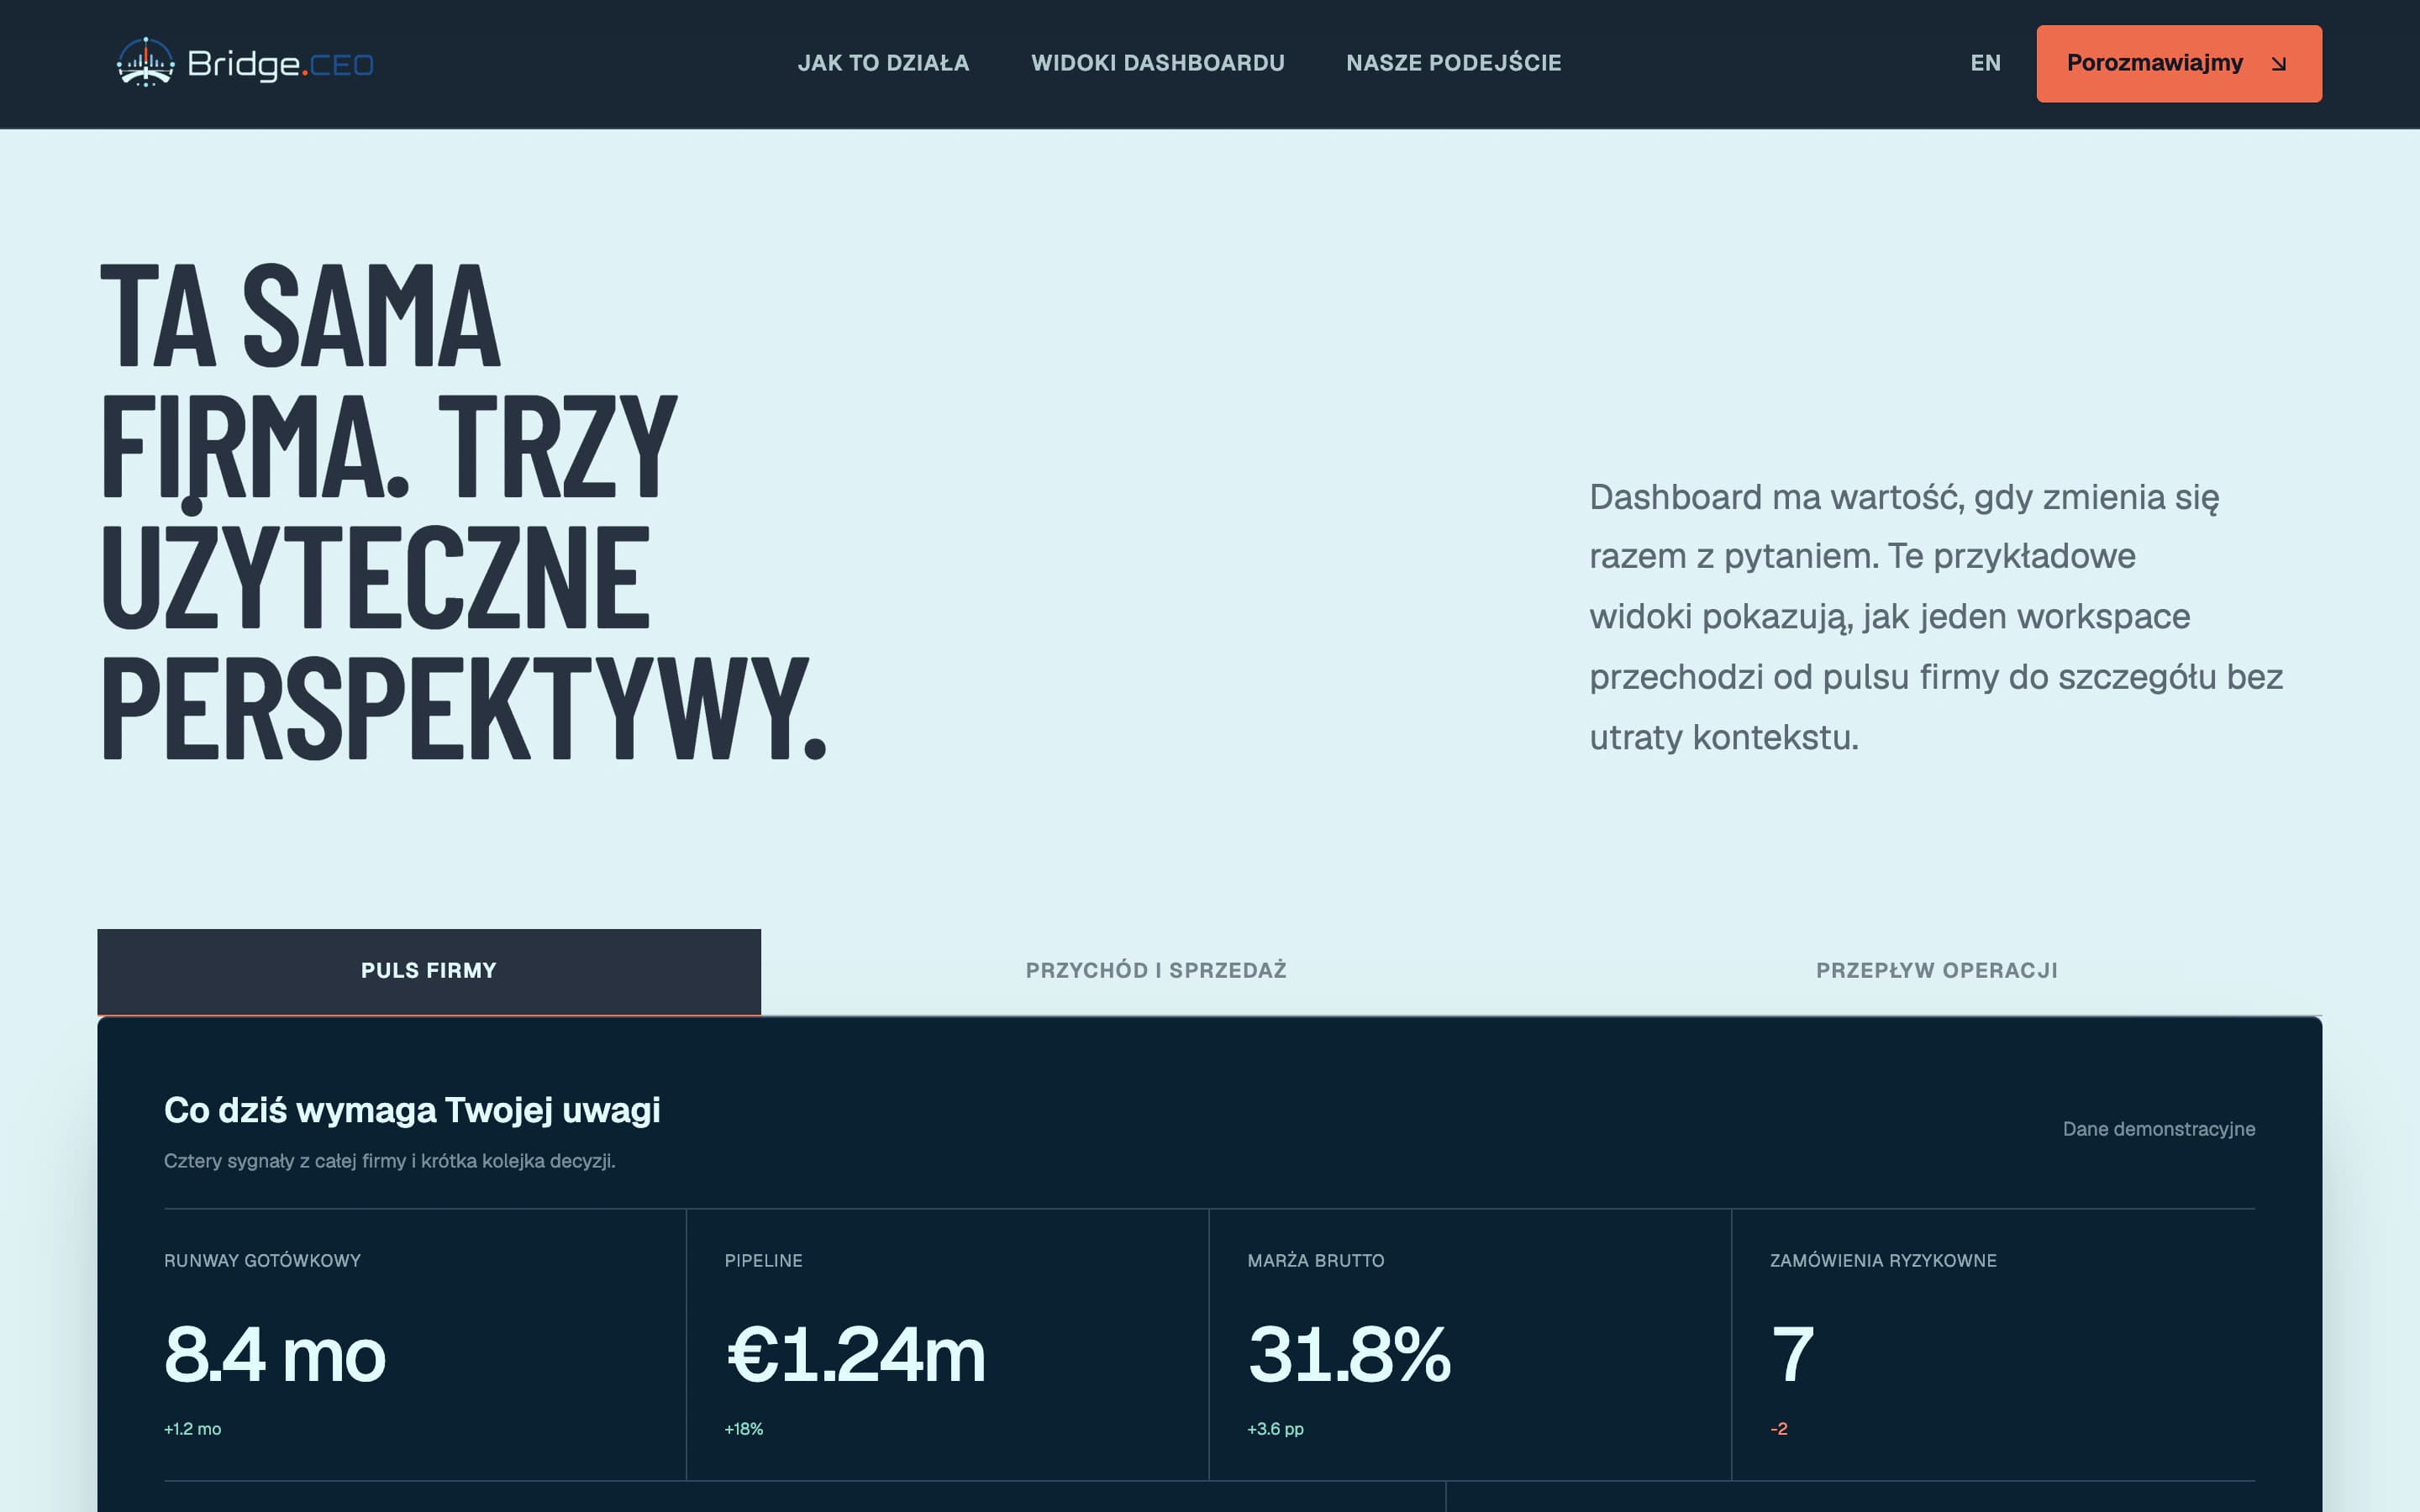
Bridge — data from multiple systems in one view.
A dashboard designed for staged development, accepting data from APIs, webhooks, databases, files and business tools before assembling it into coherent perspectives.
About the project
Important information should not end up in ten separate tabs.
Finance, sales and operations data often lives in separate systems, files and reports. The business owner is left to assemble a coherent picture manually.
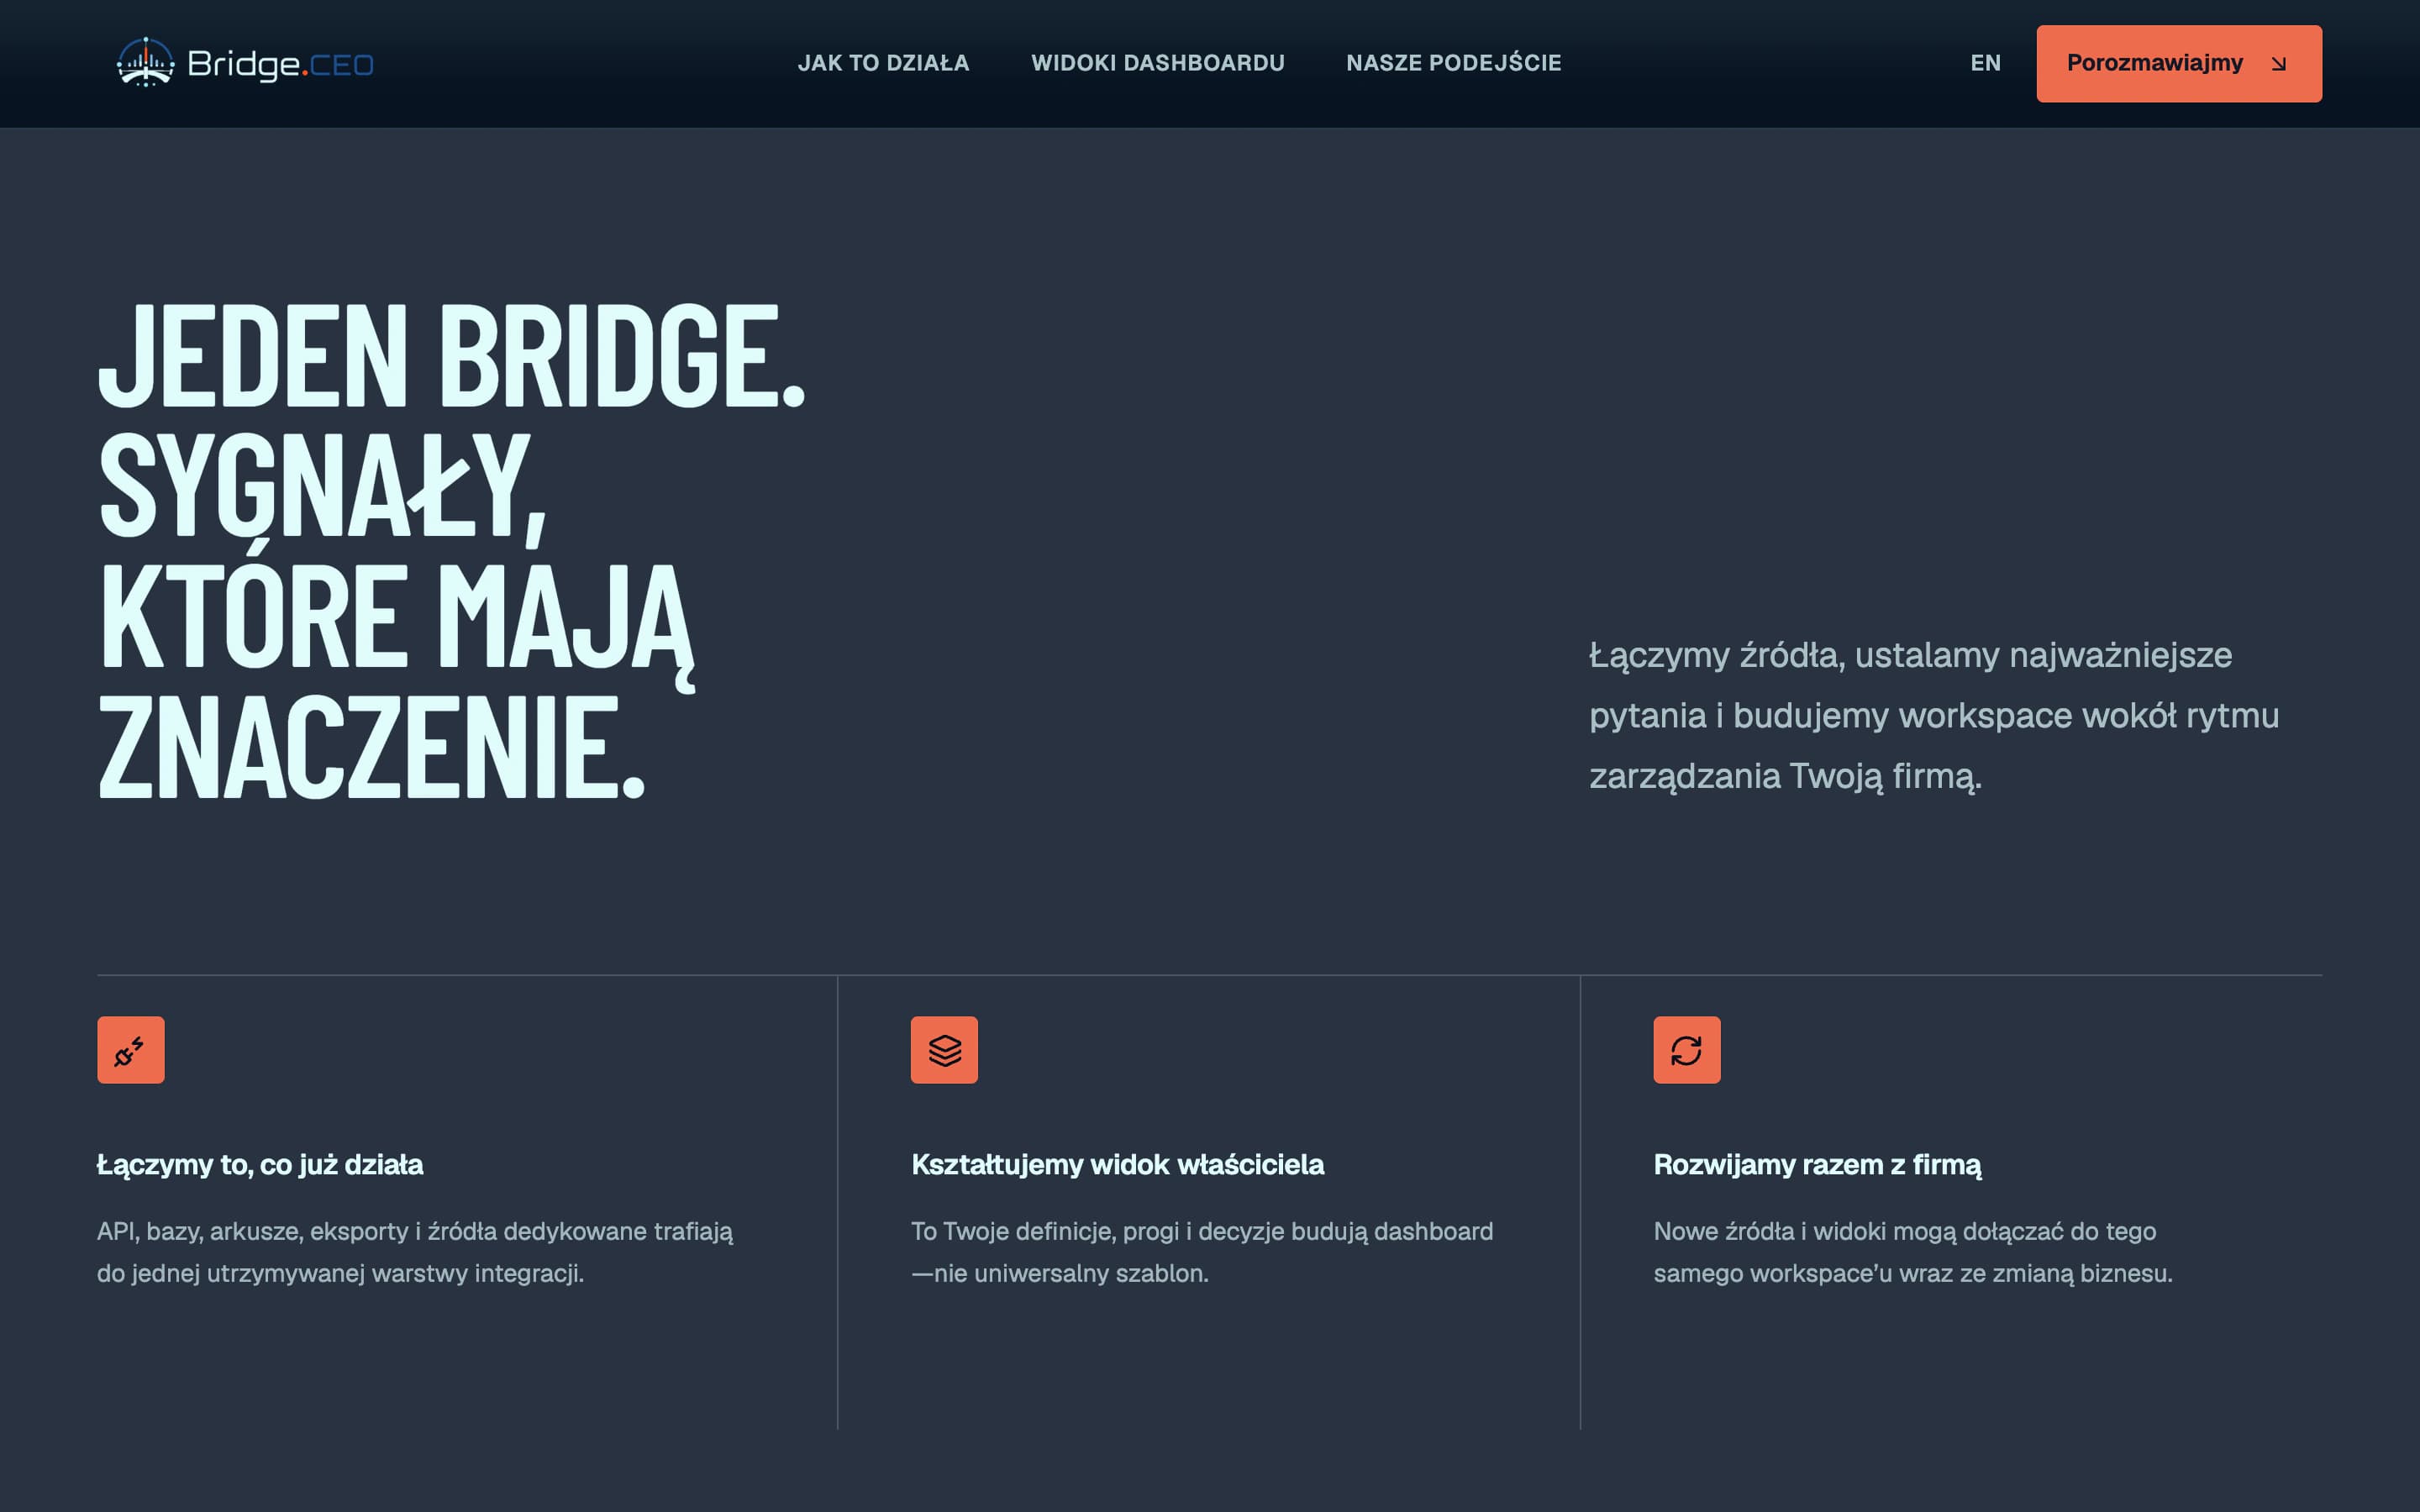
Bridge adds an integration layer above the existing environment. Sources can be connected in stages while a shared view model separates presentation from the systems supplying the data.
Solution
A data layer designed for staged development.
- 01
Data connectors
The architecture supports inputs from CRM, ERP, accounting, e-commerce, databases, spreadsheets, files, APIs and webhooks without tying the dashboard to one vendor.
- 02
Shared view model
Signals from different sources use one presentation model, maintaining consistent naming, hierarchy and context across modules.
- 03
Domain perspectives
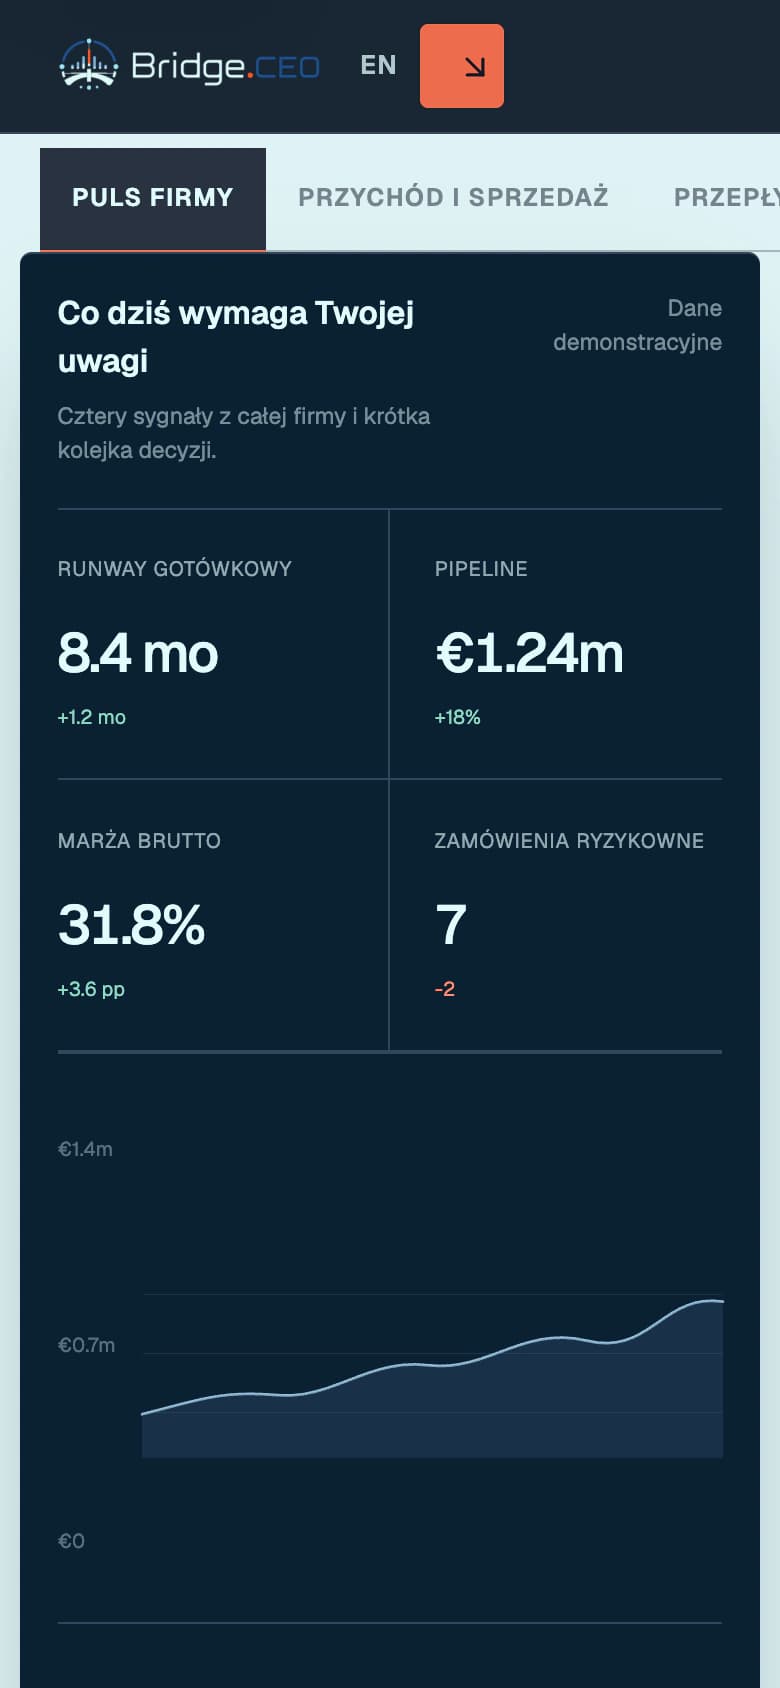
Company pulse, revenue and sales, and operational flow use shared data while arranging it around different business questions.
- 04
Extensibility
Additional sources and views can be introduced in stages without replacing the existing toolset or rebuilding the entire dashboard each time.
Outcome
One layer above a distributed environment.
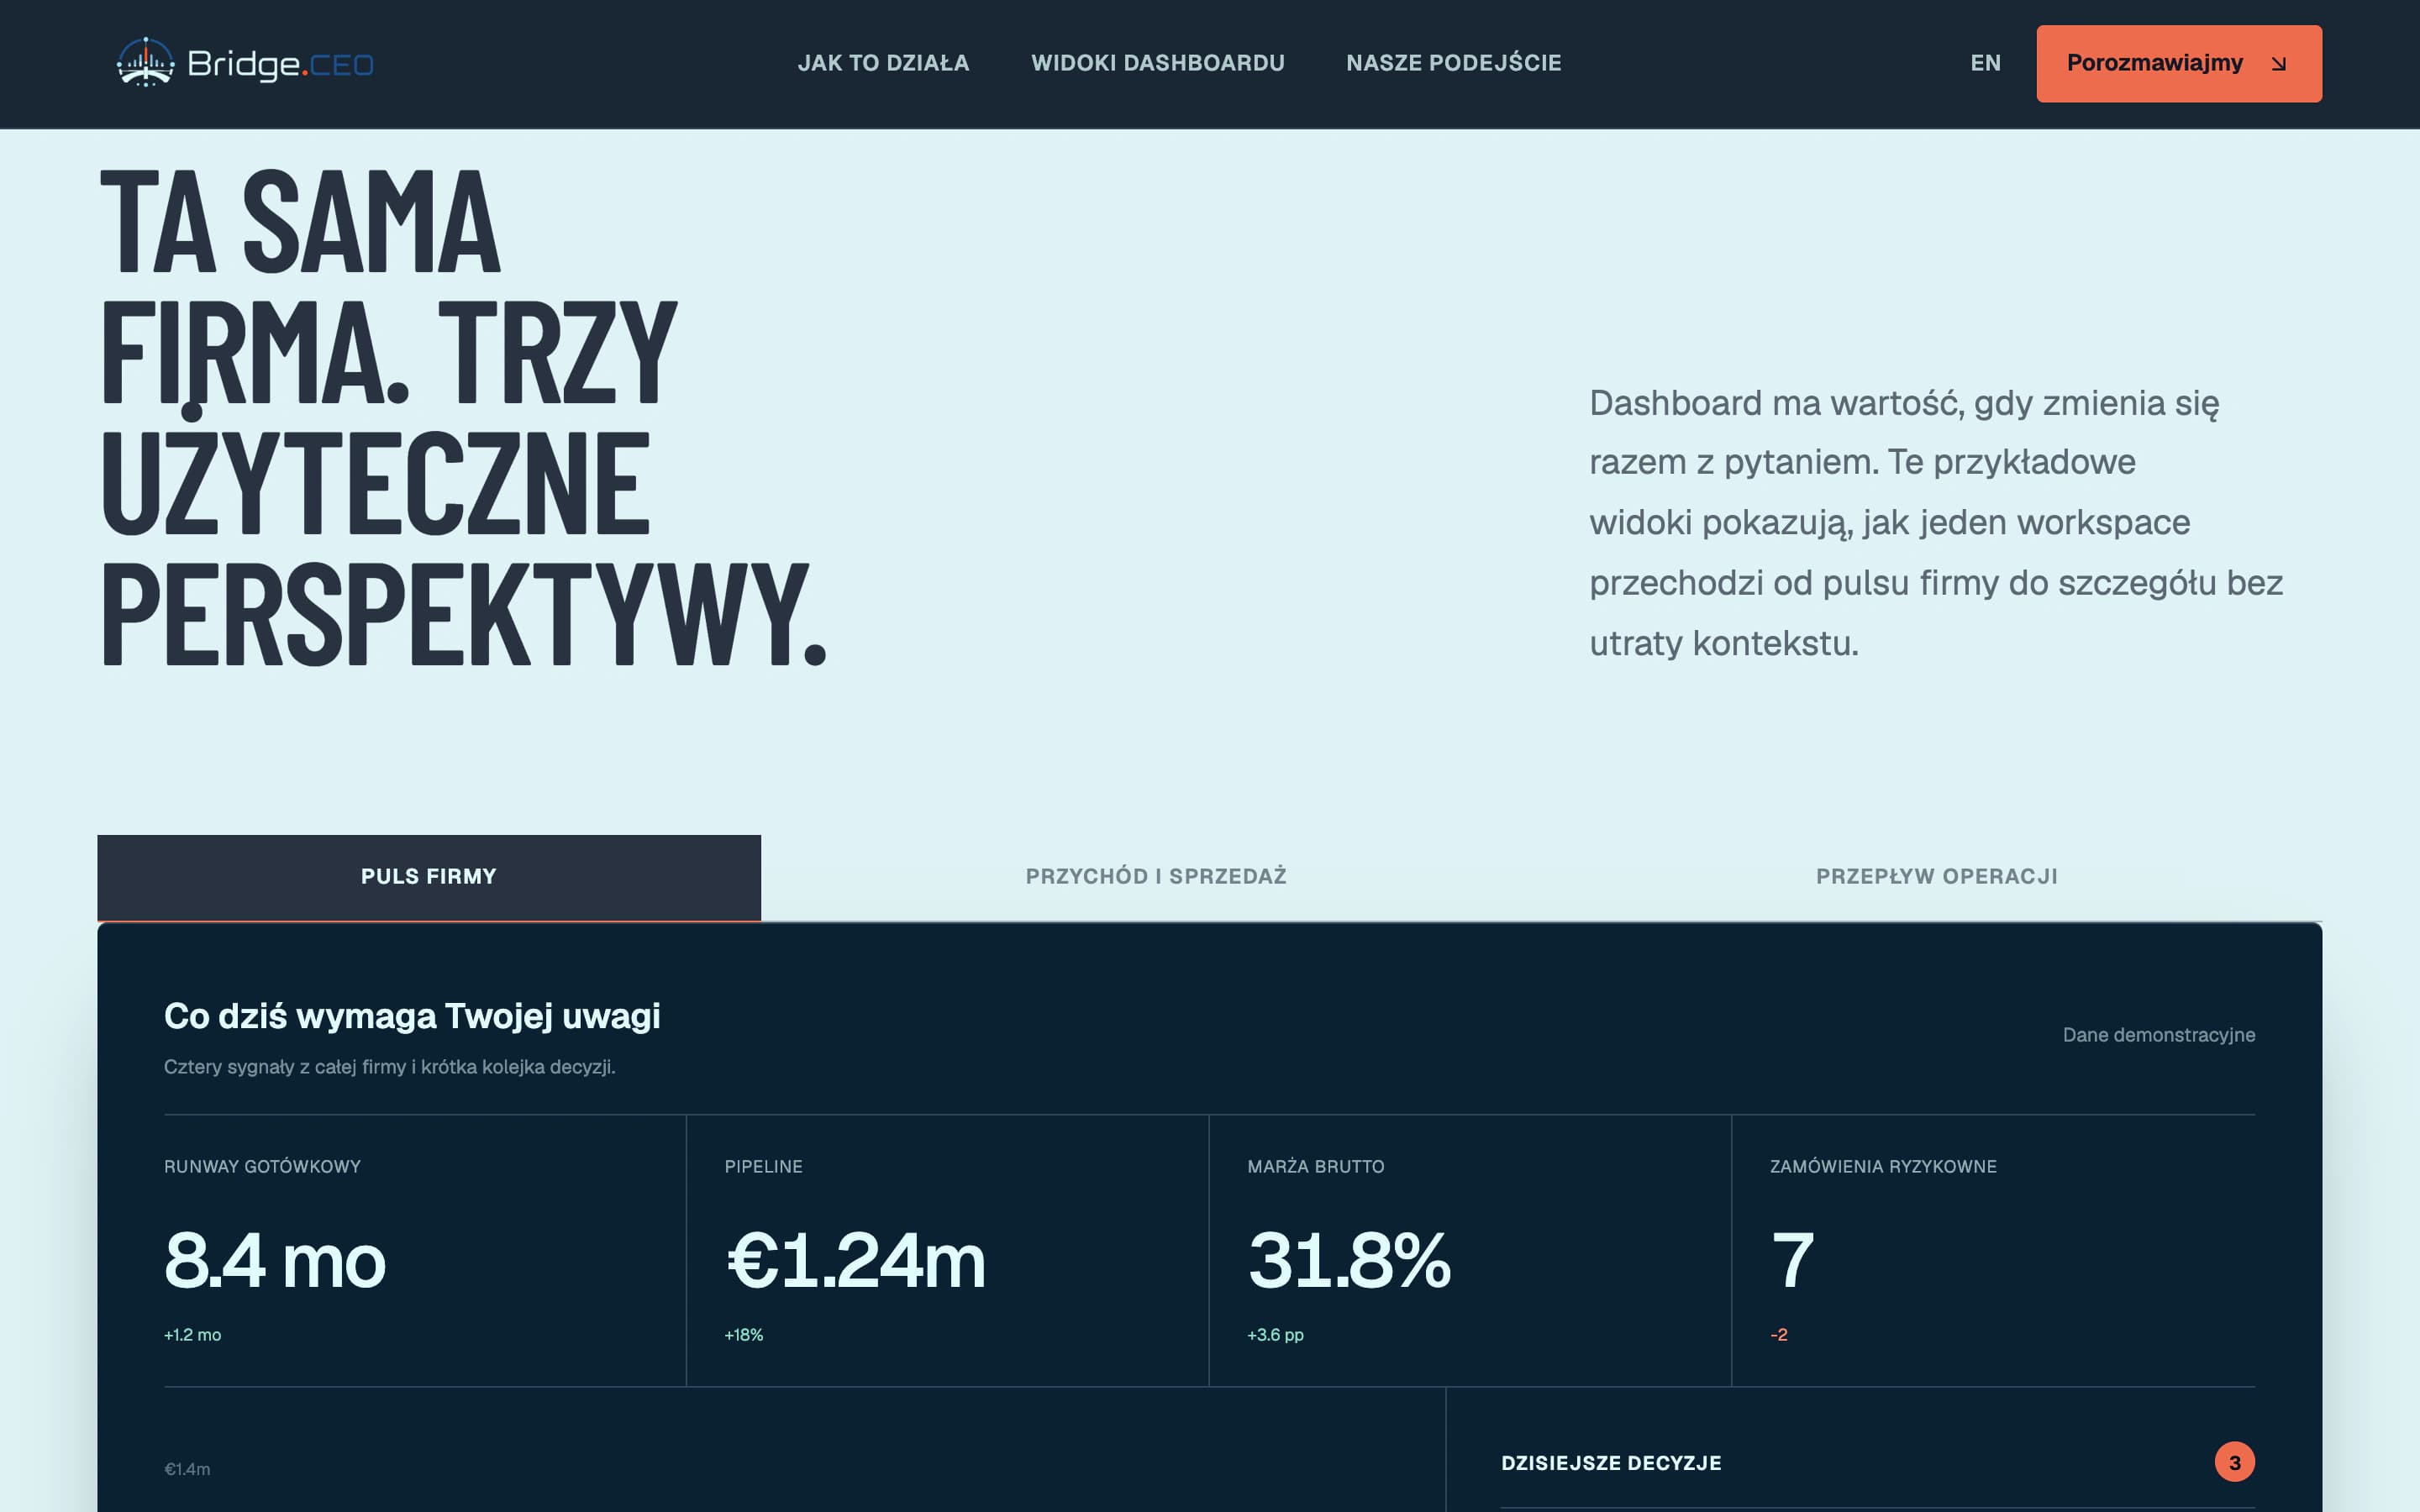
Bridge demonstrates an architecture where integrations, a shared data model and dashboard perspectives can evolve independently. Every visible value remains explicitly labelled as demonstration data.
Is your data spread across several systems?
We build integration layers and dashboards that grow with the number of sources without forcing a replacement of existing systems.